Monitoring SQLAgent Logs with ELK

As a database administrator, monitoring and analyzing log files is an essential task to ensure the smooth operation of your Microsoft SQL Server instance. In this article, we will explore how to monitor and search MSSQL Server SQLAgent logs using the Elastic Stack (ELK) on MacOS
Prerequisites
Before we begin, make sure you have Docker installed on your MacOS machine. We will be using Docker to create containers for Elasticsearch, Logstash, Kibana, and MSSQL Server with Filebeat installation.
Step 1: Create Environment File
Create a new file named .env with the following content:
.env
DB_PASSWORD=Password1234This file will store your database password, which we will use later in our configuration files.
Step 2: Configure Logstash
Create two new files: logstash.yml and logstash.conf. The former is a global configuration file for Logstash, while the latter defines the input, filter, and output settings.
logstash.yml
http.host: "0.0.0.0"logstash.conf
input {
  beats {
    port => 5044
    codec => plain {
      charset => "UTF-8"
    }
    include_codec_tag => false
  }
}
filter {
  grok {
    match => { "message" => "%{TIMESTAMP_ISO8601:log_timestamp} - %{NOTSPACE:log_severity} %{GREEDYDATA:log_message}" }
  }
  date {
    match => [ "log_timestamp" , "yyyy-MM-dd HH:mm:ss" ]
  }
  translate {
    field => "log_severity"
    destination => "severity"
    dictionary => {
      "?" => "Info"
      "+" => "Warning"
      "!" => "Error"
    }
    remove_field => "log_severity"
  }
  mutate
  {
    remove_field => [ "message" ]
  }
}
output {
  elasticsearch {
    hosts => "elasticsearch:9200"
    user => "elastic"
    password => "Password1234"
    index => "%{[@metadata][beat]}-%{+yyyy-MM-dd}"
  }
  stdout {}
}
This configuration file defines a Logstash pipeline that reads logs from Filebeat, filters and transforms the data, and then sends it to Elasticsearch.
Step 3: Create Docker Compose File
Create a new file named docker-compose.yml with the following content:
docker-compose.yml
version: '3.9'

services:
  mssql:
    # Apple M1 Chip
    platform: linux/amd64
    image: mcr.microsoft.com/mssql/server:2022-latest
    container_name: mssql
    restart: always
    env_file:
      - .env
    environment:
      ACCEPT_EULA: Y
      MSSQL_SA_PASSWORD: $DB_PASSWORD
      MSSQL_PID: Developer
      MSSQL_AGENT_ENABLED: "true"
    ports:
      - 1433:1433
    volumes:
      - mssql_datadir:/var/opt/mssql
    networks:
      - elk-mssql-network


  elasticsearch:
    # Apple M1 Chip
    platform: linux/amd64
    image: elasticsearch:7.17.10
    container_name: elasticsearch
    restart: always
    env_file:
      - .env
    environment:
      bootstrap.memory_lock: "true"
      discovery.type: single-node
      ES_JAVA_OPTS: -Xms512m -Xmx512m
      ELASTIC_PASSWORD: $DB_PASSWORD
      xpack.security.enabled: "true"
      cluster.name: elasticsearch_cluster
    ulimits:
      memlock:
        soft: -1
        hard: -1
    ports:
      - 9200:9200
      - 9300:9300
    volumes:
      - elasticsearch_datadir:/usr/share/elasticsearch/data
    networks:
      - elk-mssql-network

  kibana:
    # Apple M1 Chip
    platform: linux/amd64
    image: kibana:7.17.10
    container_name: kibana
    restart: always
    env_file:
      - .env
    environment:
      KS_JAVA_OPTS: -Xms512m -Xmx512m
      ELASTICSEARCH_HOSTS: http://elasticsearch:9200
      ELASTICSEARCH_USERNAME: elastic
      ELASTICSEARCH_PASSWORD: $DB_PASSWORD
      XPACK_SECURITY_ENABLED: "true"
    ports:
      - 5601:5601
    volumes:
      - kibana_datadir:/usr/share/kibana/data
    networks:
      - elk-mssql-network
    depends_on:
      - elasticsearch

  logstash:
    # Apple M1 Chip
    platform: linux/amd64
    image: logstash:7.17.10
    container_name: logstash
    restart: always
    environment:
      LS_JAVA_OPTS: -Xms512m -Xmx512m
    ports:
      - 5044:5044
    volumes:
      - ./logstash.yml:/usr/share/logstash/config/logstash.yml:ro
      - ./logstash.conf:/usr/share/logstash/pipeline/logstash.conf:ro
    networks:
      - elk-mssql-network
    depends_on:
      - elasticsearch


networks:
  elk-mssql-network:
    driver: bridge

volumes:
  mssql_datadir:
  elasticsearch_datadir:
  kibana_datadir:
This file defines four services: MSSQL, Elasticsearch, Kibana, and Logstash. We will use these services to create containers that run our ELK stack and sample MSSQL server.
Step 4: Start Containers
Run the following command to start all the containers:
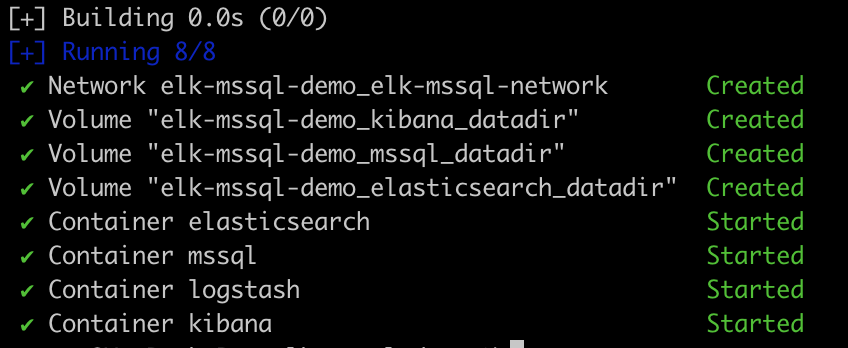
docker-compose -f docker-compose.yml up -dThis command will create and start all the containers in detached mode.

Step 5: Configure Filebeat
Create a new file named filebeat.yml with the following content:
filebeat.yml
filebeat.inputs:
- type: log
  enabled: true
  paths:
    - /var/opt/mssql/log/sqlagent.out
  encoding: utf-16le-bom

filebeat.config.modules:
  path: ${path.config}/modules.d/*.yml
  reload.enabled: false
  setup.template.settings:
    index.number_of_shards: 1

# output.elasticsearch:
#   hosts: ["elasticsearch:9200"]
#   username: elastic
#   password: Password1234

setup.kibana:
  host: "kibana:5601"

output.logstash:
  hosts: ["logstash:5044"]
This configuration file defines a Filebeat pipeline that reads logs from the SQLAgent output file and sends them to Logstash.
Step 6: Install Filebeat
Create a new file named install_filebeat.sh with the following content:
install_filebeat.sh
apt-get update
apt-get -y install curl vim
curl -L -O https://artifacts.elastic.co/downloads/beats/filebeat/filebeat-7.17.10-amd64.deb
dpkg -i filebeat-7.17.10-amd64.deb
mv /etc/filebeat/filebeat.yml /etc/filebeat/filebeat.yml.bkp
This script installs Filebeat and configures it to read logs from the SQLAgent output file.
Step 7: Start Filebeat
Run the following command to start Filebeat:
docker exec -u 0 -i mssql bash < ${work_dir}/install_filebeat.sh

docker cp ${work_dir}/filebeat.yml mssql:/etc/filebeat/filebeat.yml

docker exec -u 0 -i mssql chown root:root /etc/filebeat/filebeat.yml

docker exec -u 0 -i mssql service filebeat start
This command will install and configure Filebeat in the MSSQL container.

Step 8: Monitor SQLAgent Logs
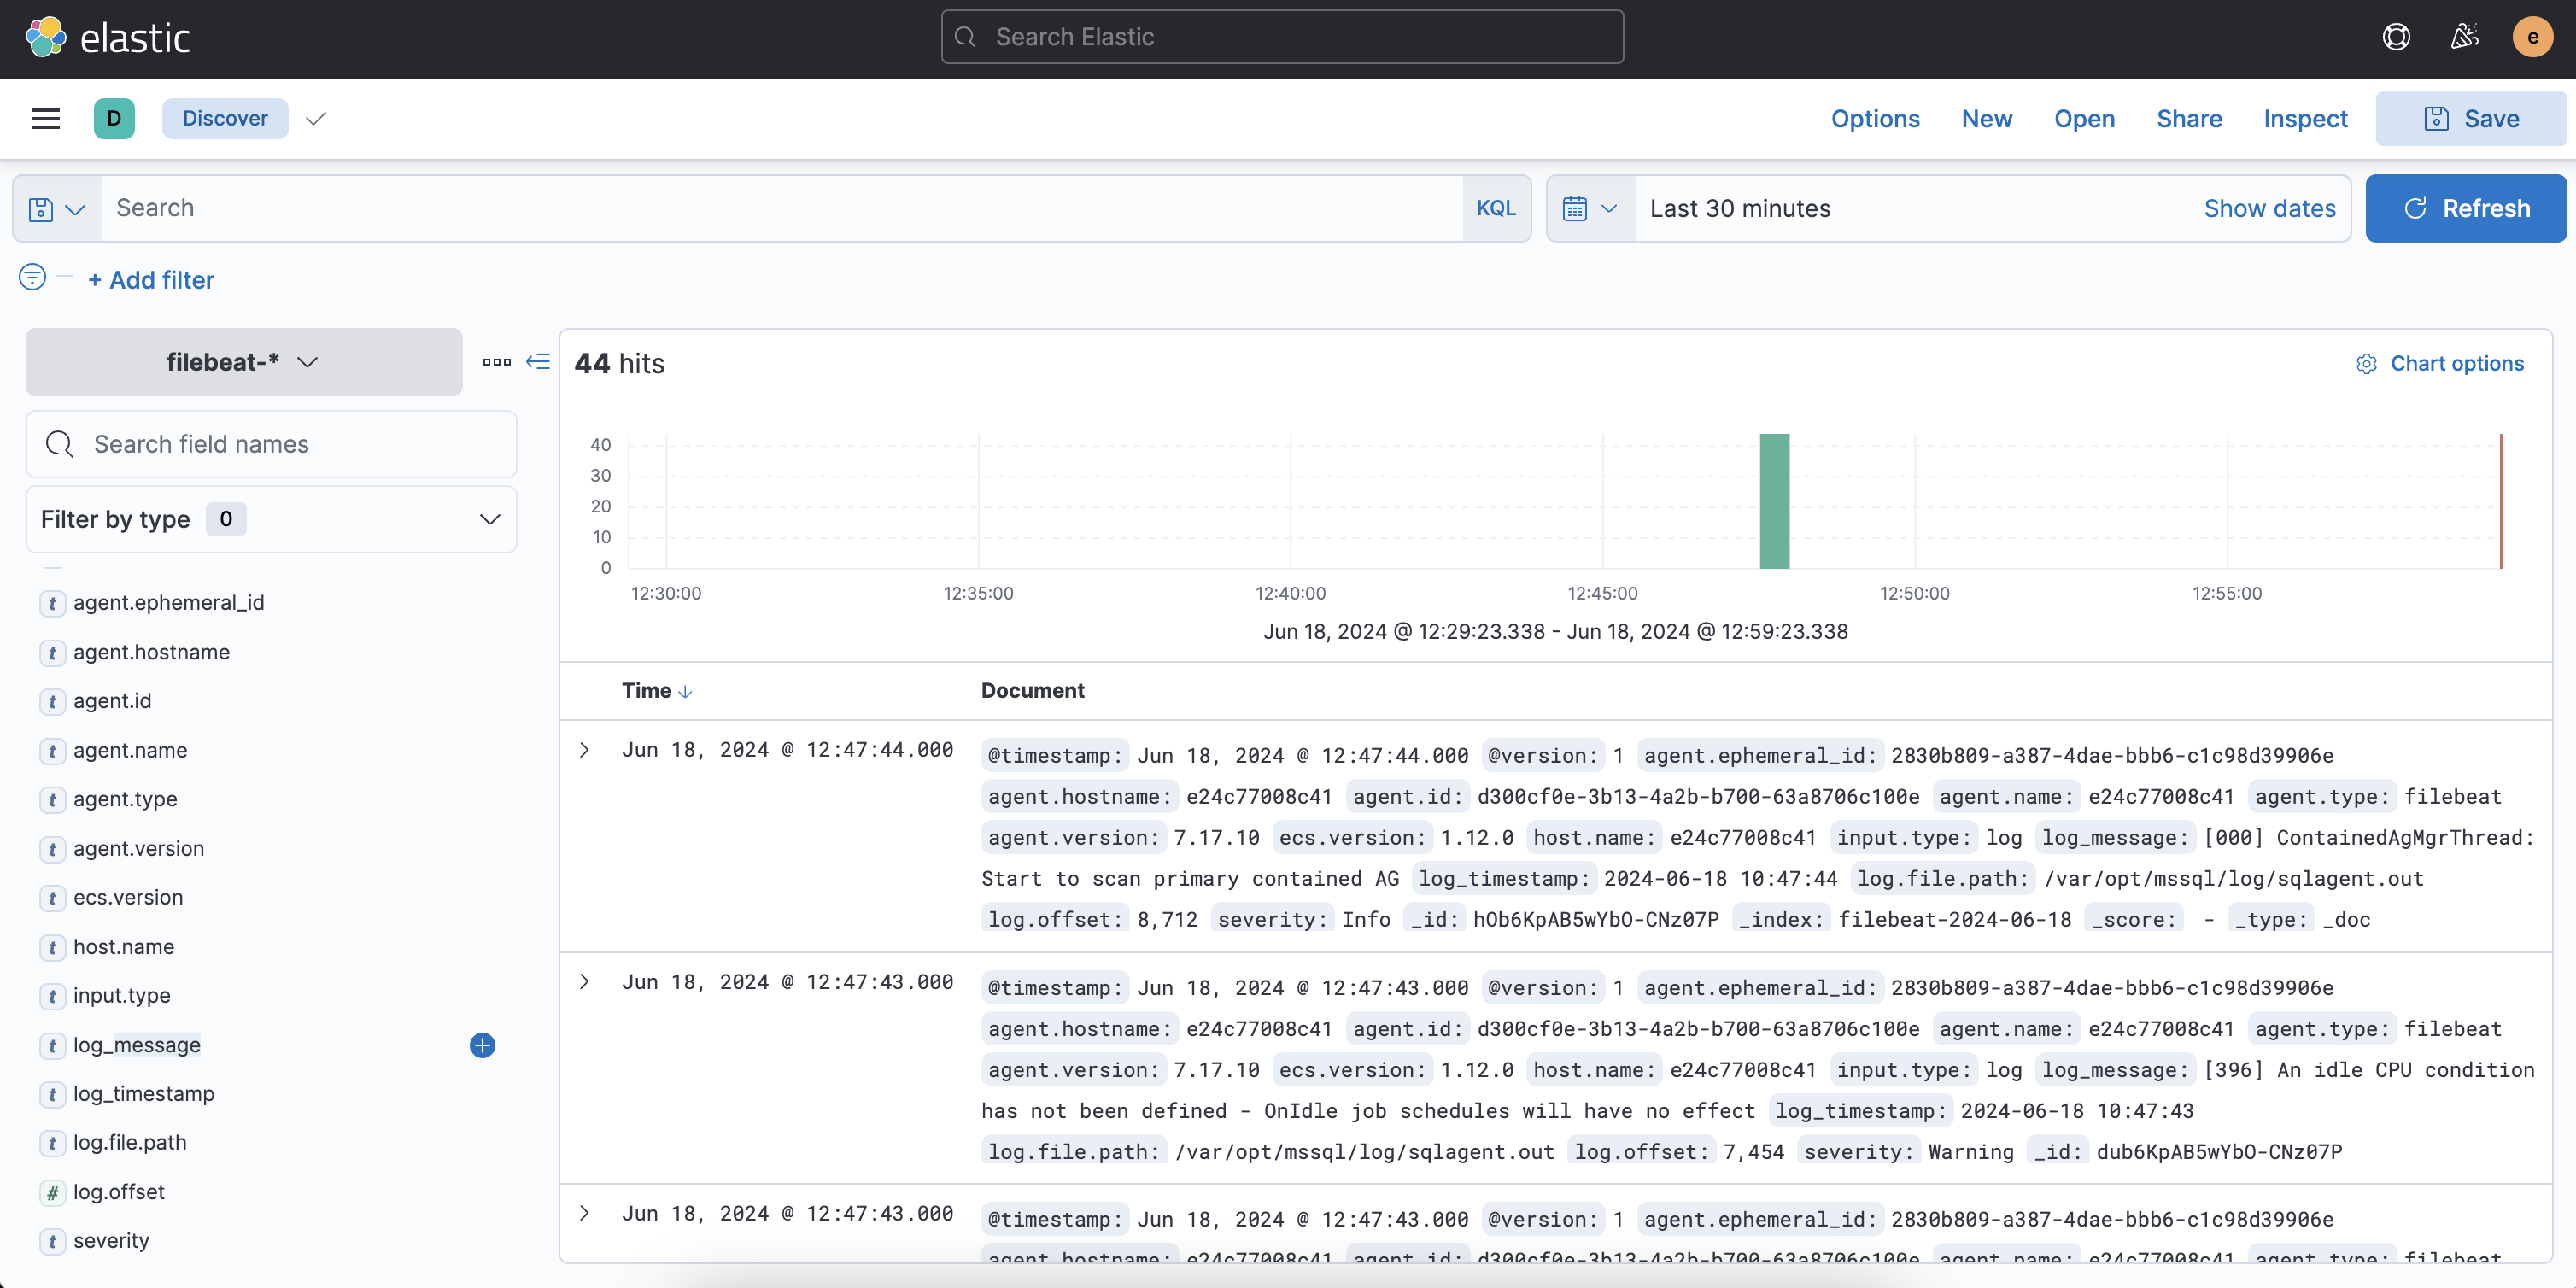
Open Kibana console at http://localhost:5601. Log in with elastic username & password. Next we will create an index pattern to monitor the SQLAgent logs.
Create Index Pattern

Now we can monitor, search, filter, and analyze the SQLServer Agent logs using Kibana's powerful visualization tools.

In this article, we have demonstrated how to monitor and search MSSQL Server SQLAgent logs using the Elastic Stack (ELK) on MacOS. We created containers for Elasticsearch, Logstash, & Kibana, configured our services, and installed and started Filebeat in the MSSQL container. With these steps, we can now monitor our SQLAgent logs and gain valuable insights into our database operations.
Finally we stop all the Containers and cleanup.
docker-compose -f docker-compose.yml down -v
